−12.1 → −6.2 cm
(−4.8 → −2.4 in)
We check every time series for radar jumps
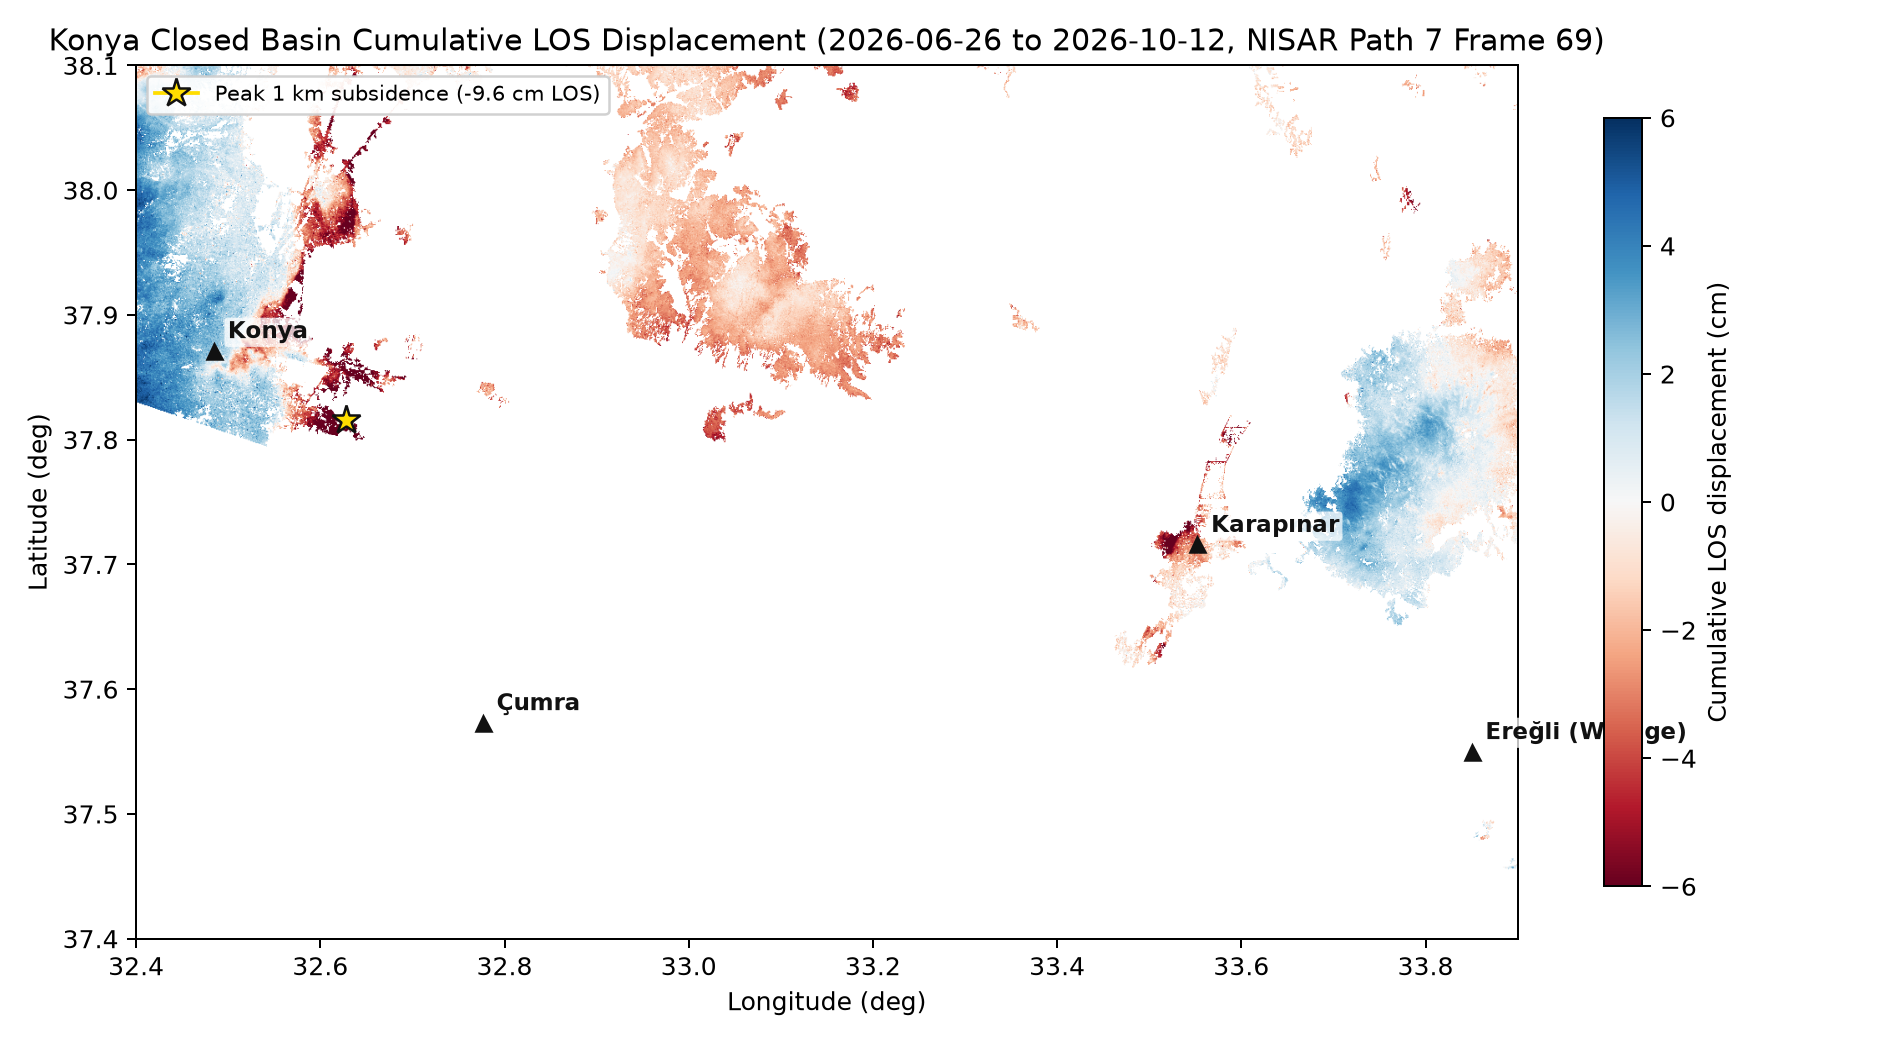
Review corrected Semarang; Konya and Beijing remain marked indicative while their signals are checked.
 NISAR Vision
NASA Space Apps 2026 · Cambridge, MA
Using the first data from NASA and ISRO's new NISAR radar satellite, we built one open method that turns radar echoes into centimetres of ground sinking, ran it on 29 basins over the same 93 days, and checked every number.
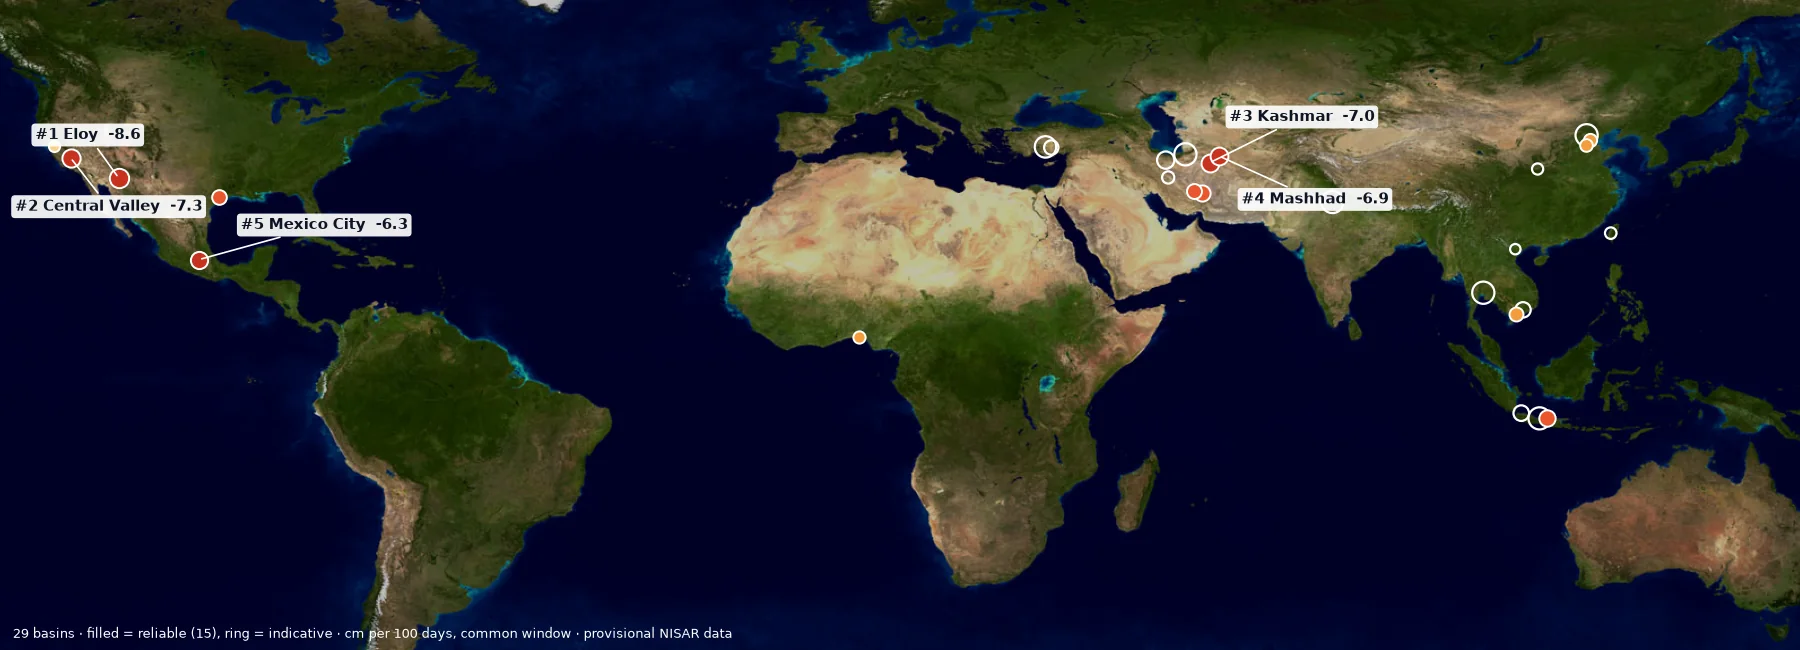
Rates in cm/100d (centimetres per 100 days; 1 in = 2.54 cm) along satellite LOS (line of sight: toward or away from the radar), from NASA-JPL GUNW (Geocoded Unwrapped Interferogram: paired radar images processed to show ground movement). NISAR data are provisional. Calibration and validation are carried out by the NISAR project (NASA-JPL and ISRO), not by our team.
What we built · in one look
What it is: ground motion maps for 29 basins on three continents, all made the same way from NISAR's first radar data and ranked on the same 93 days.
Why it matters: for the first time you can compare sinking in Türkiye, Iran, Mexico, California and Asia side by side, with the same ruler.
Checks behind the map
−12.1 → −6.2 cm
(−4.8 → −2.4 in)
Review corrected Semarang; Konya and Beijing remain marked indicative while their signals are checked.
r = 0.92
Across 10 California stations, the root mean square difference is 1.4 cm (0.6 in).
15 / 29
Only basins that pass the checks enter the reliable ranking.
What it is: each atlas map overlaid with a population map (GHSL 2025), counting only sinking larger than twice the measurement noise.
Why it matters: it turns centimetres into people, the number a city or ministry needs.
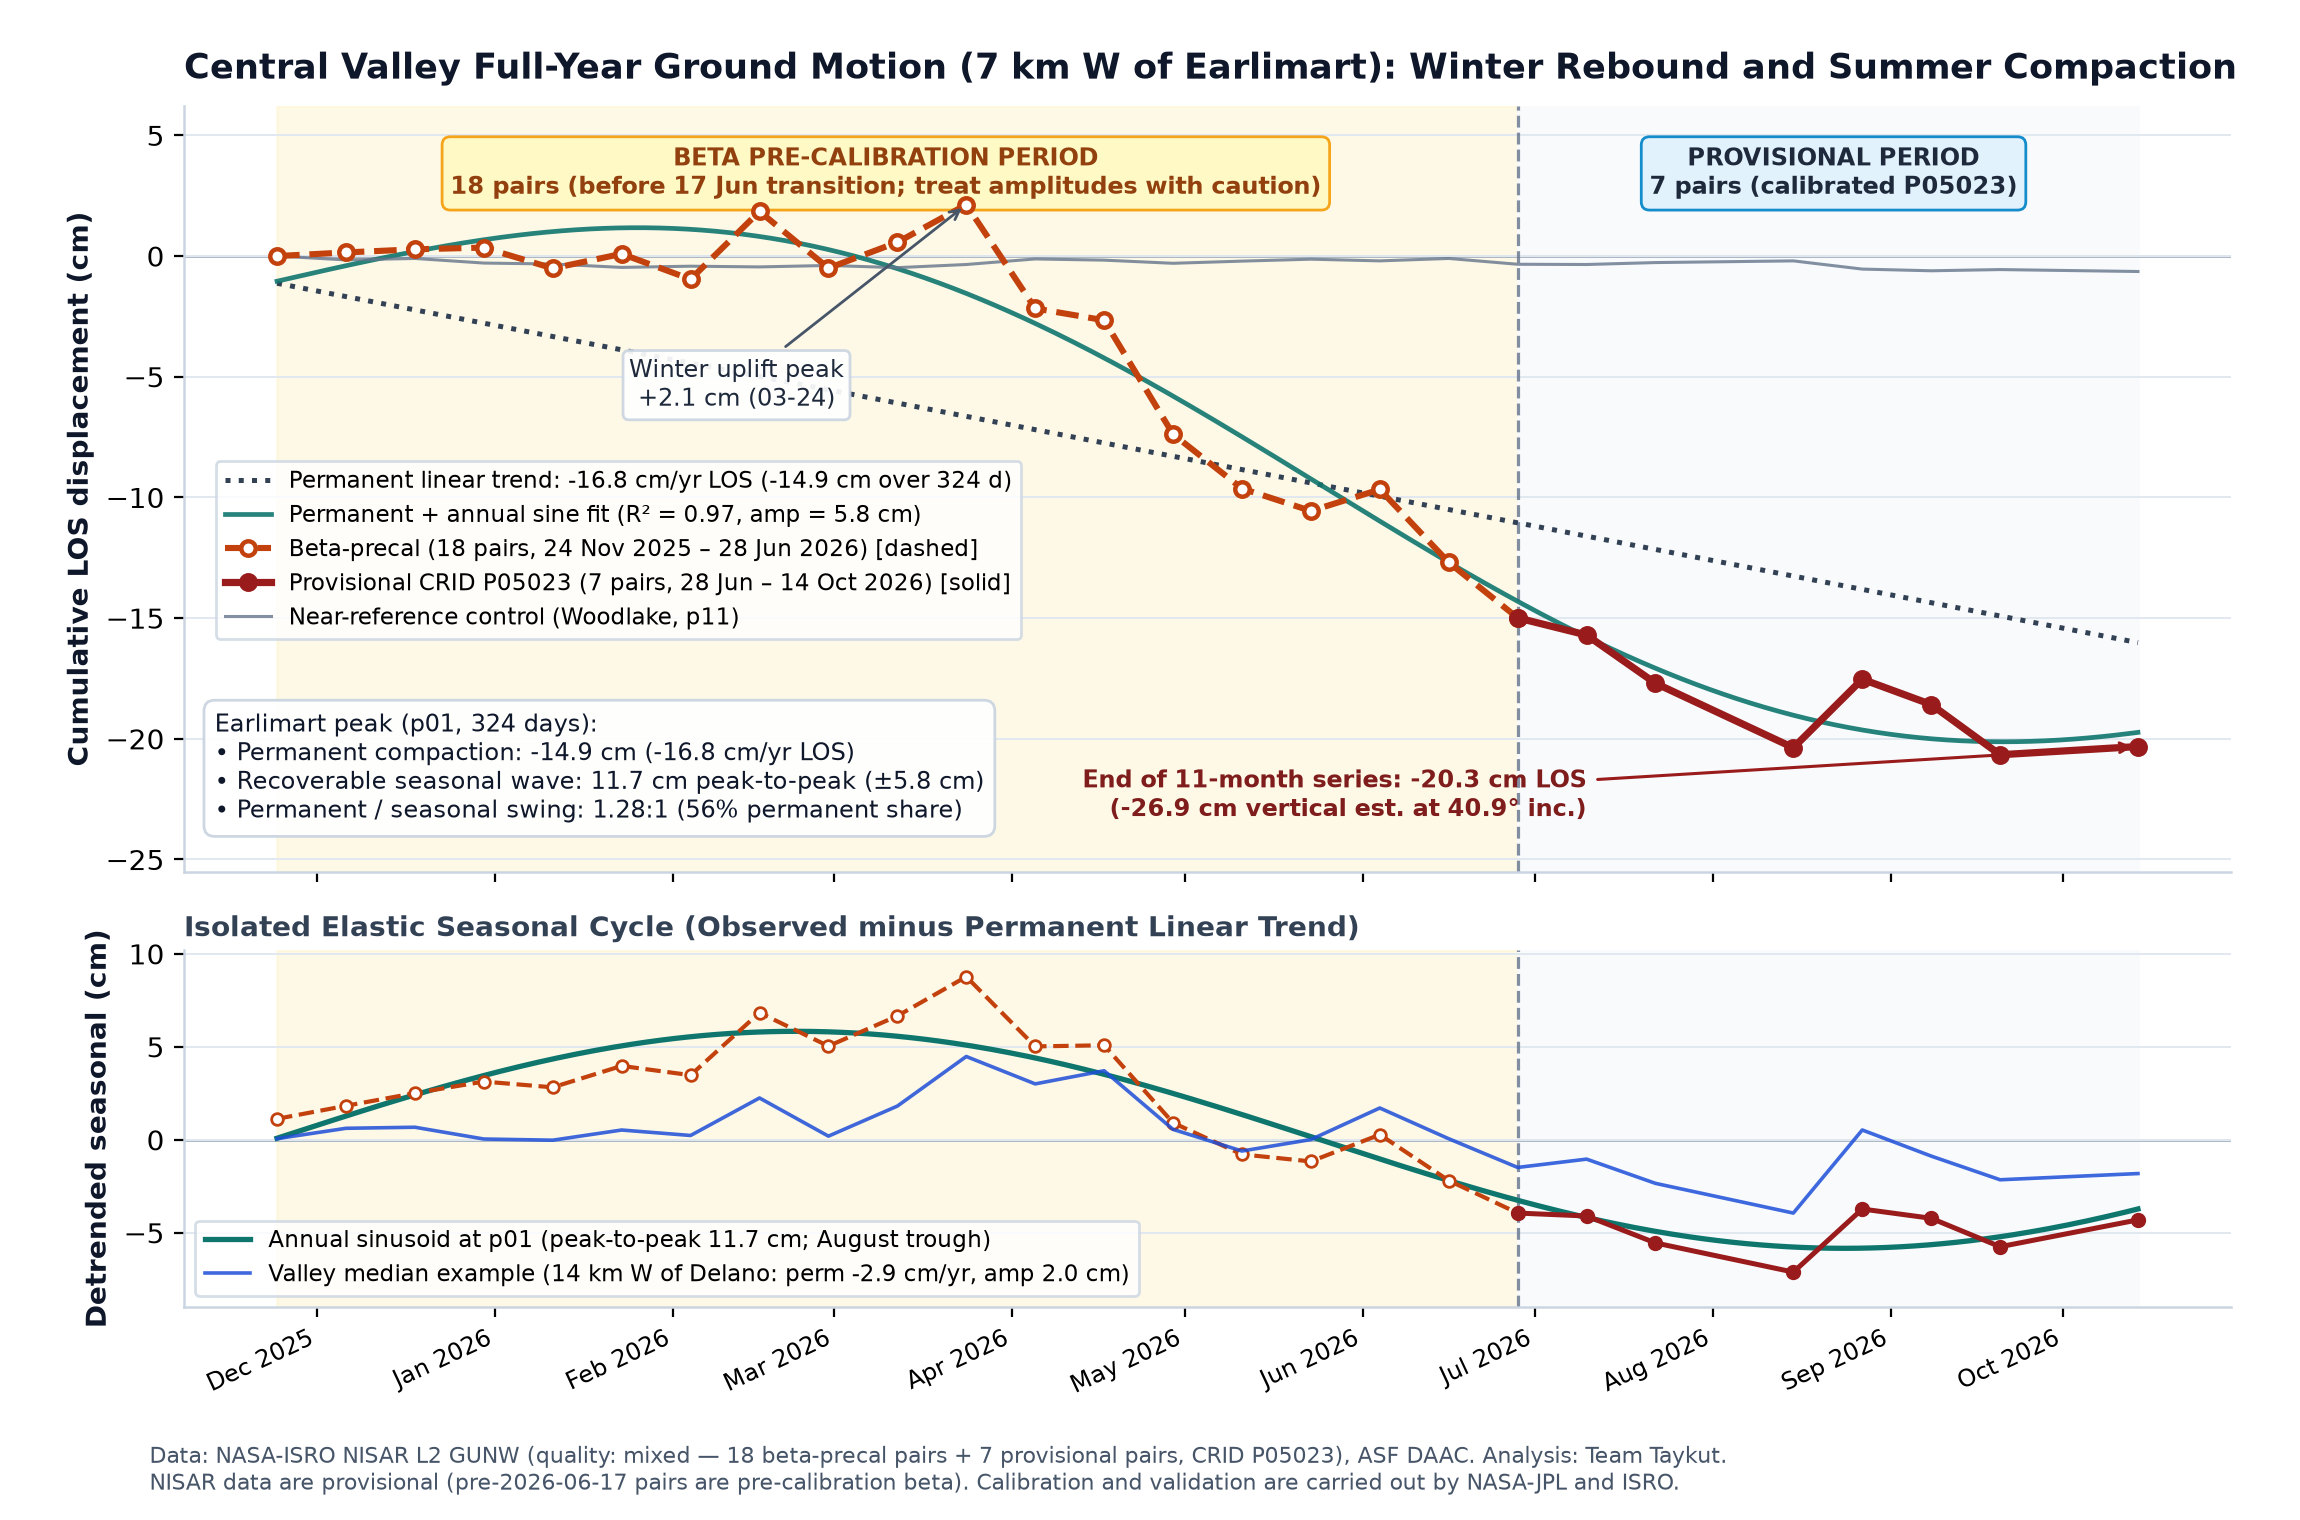
What it is: eleven months of NISAR data split into ground that bounces back each winter and ground that does not. The part that does not come back is squeezed clay: aquifer space lost forever.
Why it matters: water managers count it in cubic kilometres, so we did too.
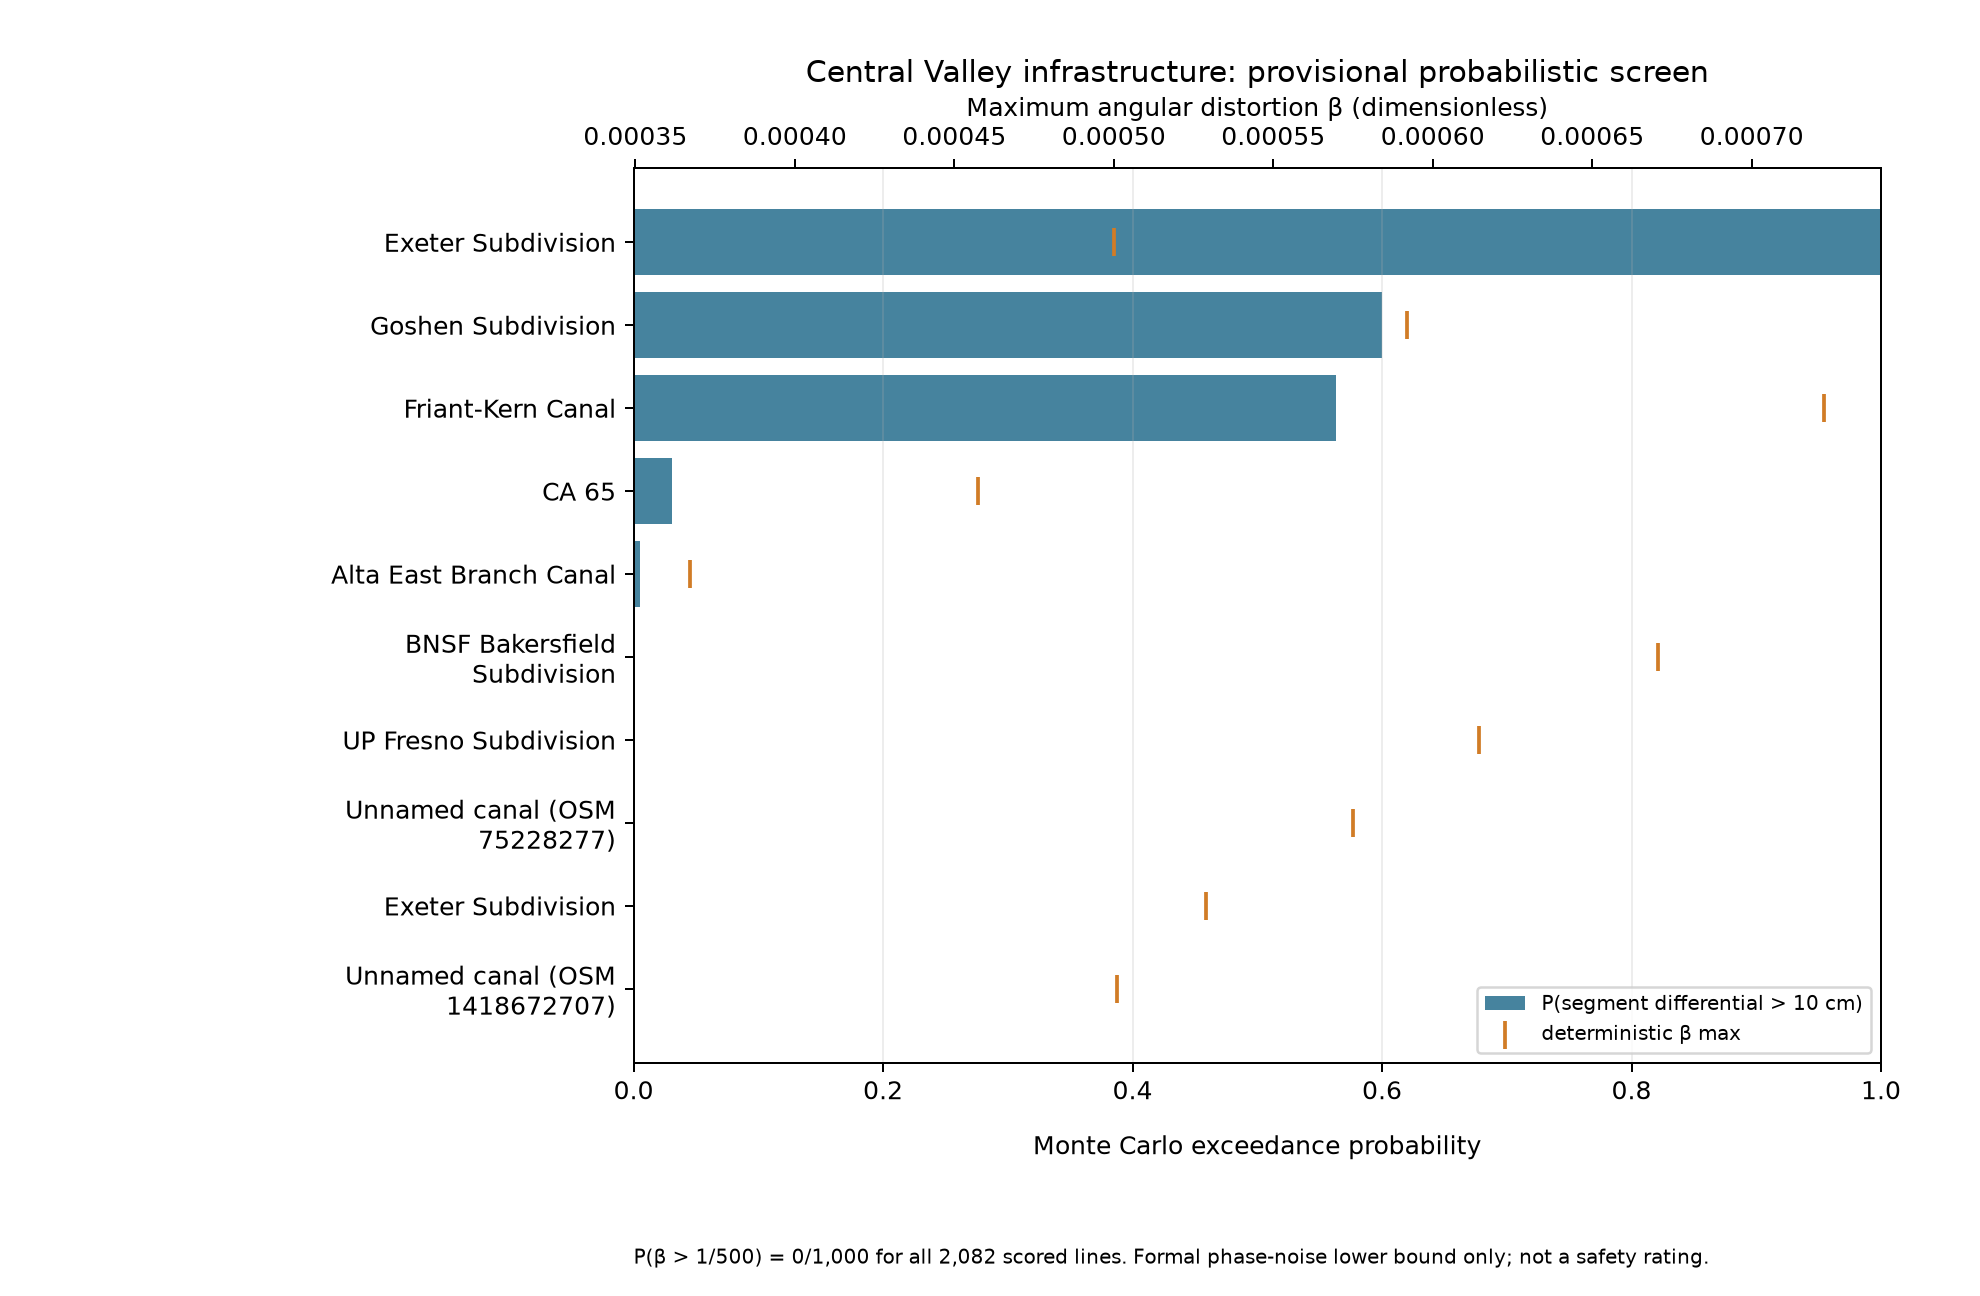
What it is: every canal, road and railway line in the Central Valley checked for uneven sinking, with a probability that includes our measurement error.
Why it matters: uneven sinking cracks canals and tilts tracks; engineers can see which section to inspect first.
What it is: 29 printable bulletins in the style of NASA disaster products: rate, worst areas, people affected, confidence, revision history.
Why it matters: a water manager does not read papers; one page with the number and its reliability is what they use.
Open the Konya Plain bulletin →What it is: run a farming valley for 24 months. Pump more and earn more, but watch the ground sink and part of it never come back.
Why it matters: the model reproduces what NISAR measured, so students and farmers learn from real data, in 30 seconds.
Play the simulator → Play Aquifer Run → For kids: Water Hero →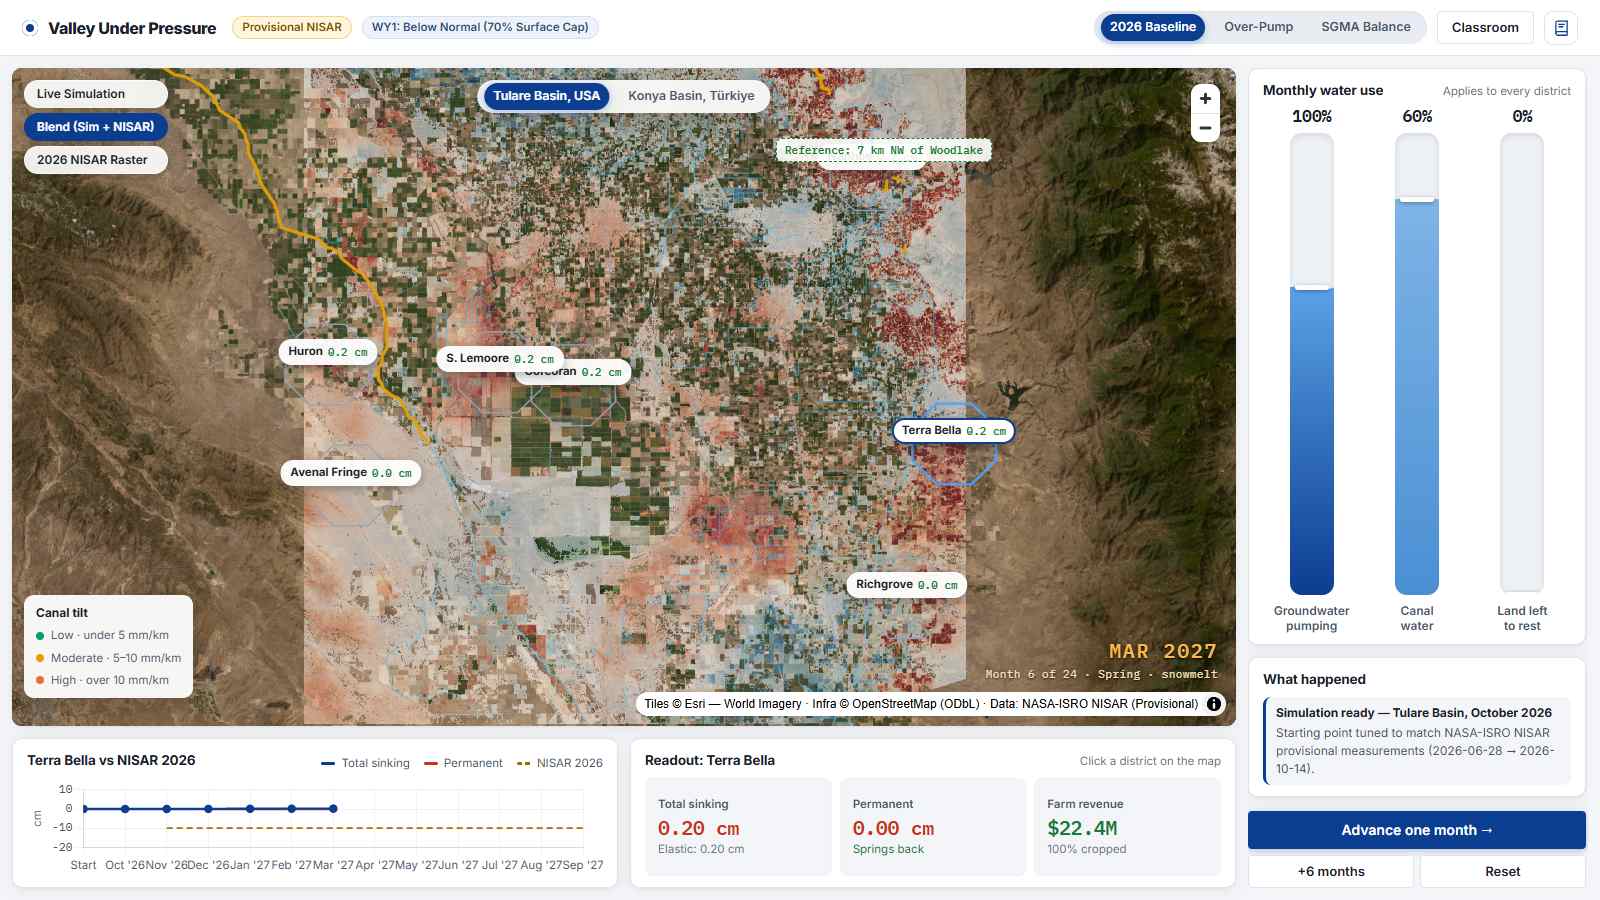
What it is: NISAR Vision, the pipeline behind every number here. One command searches NASA's archive, downloads, measures and checks a new region.
Why it matters: any agency or student can repeat our atlas for their own city, and check our work.
Get the code and data →# measure a new region from public NASA data python -m pipeline.nisarvision run \ --name konya --bbox 32.4,37.4,33.9,38.1 \ --start 2026-06-17 --end 2026-10-31 # rebuild and self-check the atlas python pipeline/pc10/build_atlas.py