Peak Cumulative (LOS)
-7.8 cm
Vertical Est. (39.1°)
-10.1 cm
3-Ref Sensitivity
[-7.8, -4.7] cm LOS
Rate (cm / 100 days)
-7.2 cm/100d
Annualized est.: -26.4 cm/yr
Latest Pair & Cumulative Summary
- Latest Consecutive Pair Step: -1.56 cm LOS (2026-09-20 to 2026-10-14 at p01: 6 km N of Terra Bella; cumulative at point: -7.80 cm)
- Affected Population (GHSL GHS-POP E2025, 108d eq., ≥ 0.59 cm 2σ): 92,134 residents (< -2 cm), 3,004 residents across 239.84 km² (< -5 cm).
Top 3 Most-Subsiding Areas
| Rank | 1 km Block Center (Lat, Lon) | Cumulative LOS | Rate |
|---|---|---|---|
| #1 | 36.0112, -119.0217 | -7.80 cm | -7.22 cm/100d |
| #2 | 36.1163, -119.8447 | -7.78 cm | -7.21 cm/100d |
| #3 | 36.1272, -120.1570 | -7.22 cm | -6.68 cm/100d |
Top 5 At-Risk Infrastructure Segments
Source: O2 probabilistic infrastructure risk (assets_prob.json)
| # | Segment | Type | Max Diff (90% CI) | Beta Max | P(Diff > 10 cm) | P(Beta > 1/1000 | 1/500) |
|---|---|---|---|---|---|---|
| 1 | Exeter Subdivision | rail | 12.56 cm [11.8, 13.7] | 5.00e-04 | 100.0% | 0.0% / 0.0% |
| 2 | Goshen Subdivision | rail | 9.78 cm [9.4, 11.0] | 5.92e-04 | 60.0% | 0.0% / 0.0% |
| 3 | Friant-Kern Canal | canal | 9.88 cm [9.2, 11.1] | 7.23e-04 | 56.3% | 0.0% / 0.0% |
| 4 | CA 65 | trunk | 8.74 cm [7.7, 9.9] | 4.57e-04 | 3.1% | 0.0% / 0.0% |
| 5 | Alta East Branch Canal | canal | 8.48 cm [7.8, 9.5] | 3.67e-04 | 0.5% | 0.0% / 0.0% |
GNSS Comparison & Calibration Status
10 continuous GNSS stations compared: median time-series RMSE 1.00 cm, median correlation r = 0.54 (sample stations: CAD1, CAFP, CAHA, HANF, P056, P564).
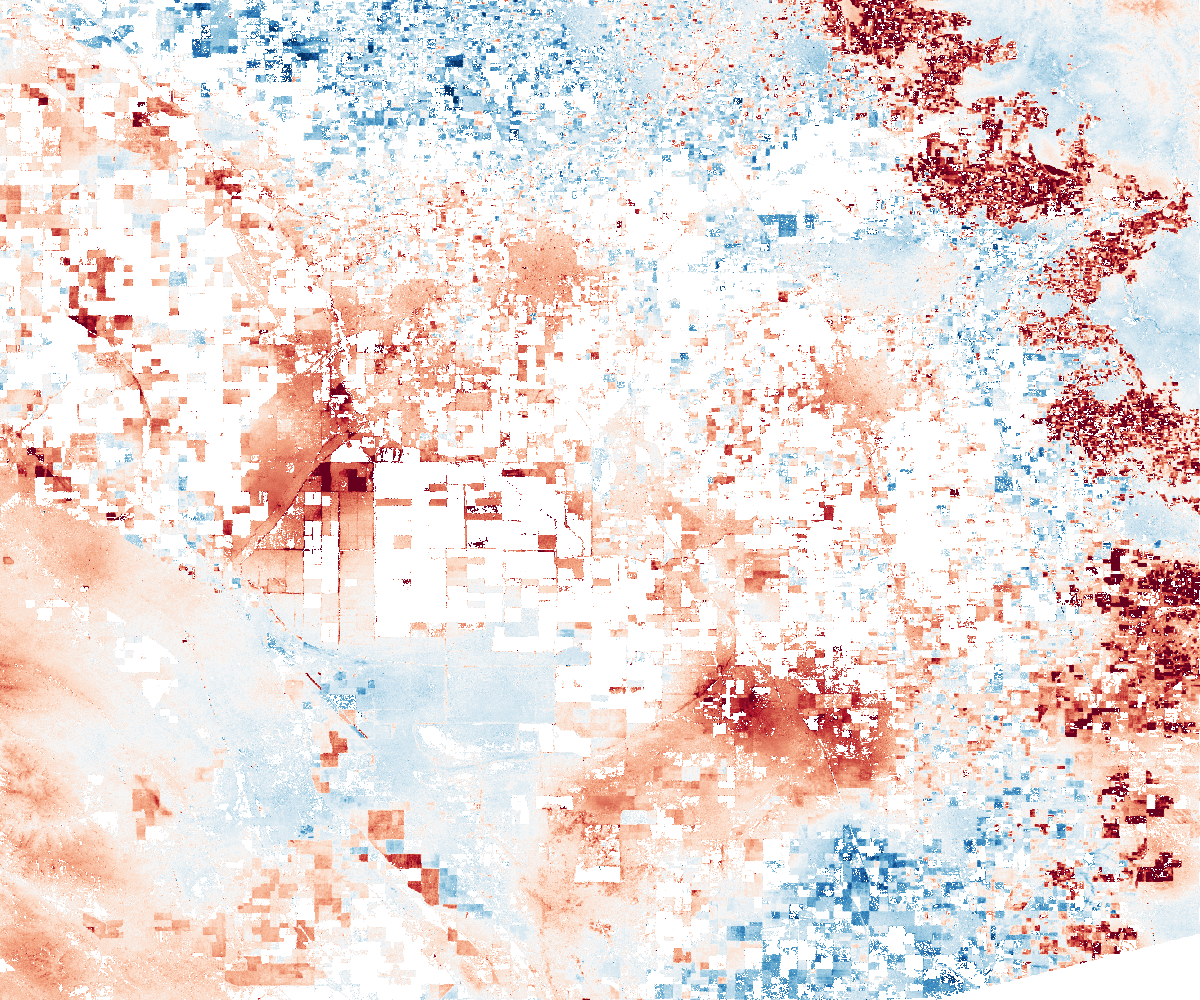
Cumulative Displacement Map
What This Means
- Ground in Central Valley (Tulare Basin) (USA) subsided up to -7.8 cm LOS (-7.2 cm/100d) between 2026-06-28 and 2026-10-14, consistent with active seasonal compaction.
- About 92,134 residents live on ground sinking faster than 2 cm per 108 days (and 3,004 residents across 239.84 km2 faster than 5 cm per 108 days, above the 0.59 cm 2-sigma noise floor).
- Infrastructure screening flags Exeter Subdivision as the highest-differential segment in this footprint; pair satellite tracking with local leveling or groundwater head checks before field action.
Calibration & Quality Notice (PROVISIONAL): NISAR data are provisional. Calibration and validation are carried out by the NISAR project (NASA-JPL and ISRO), not by our team.
Sources: NASA-ISRO NISAR L2 GUNW (CRID P05023 via ASF DAAC); GHSL GHS-POP E2025 R2023A (JRC, CC BY 4.0); Nevada Geodetic Laboratory GNSS; OpenStreetMap (ODbL).
Sources: NASA-ISRO NISAR L2 GUNW (CRID P05023 via ASF DAAC); GHSL GHS-POP E2025 R2023A (JRC, CC BY 4.0); Nevada Geodetic Laboratory GNSS; OpenStreetMap (ODbL).