Under revision (literature_mismatch, noisy_series): Automated time-series QC flagged this headline series for independent review — Headline -7.5 cm LOS in 108 days implies roughly 10x the published recent rates (about 0.9 cm/yr on average, locally above 2 cm/yr, Sentinel-1 PS-InSAR 2016-2019; 1-3 cm/yr in 2005-2010 InSAR); the headline series has +/-4-5 cm steps in both directions, typical of tropical decorrelation..
Peak Cumulative (LOS)
-7.5 cm
Vertical Est. (34.0°)
-9.0 cm
3-Ref Sensitivity
[-7.9, -7.5] cm LOS
Rate (cm / 100 days)
-6.2 cm/100d
Annualized est.: -22.8 cm/yr
Latest Pair & Cumulative Summary
- Latest Consecutive Pair Step: +2.88 cm LOS (2026-10-07 to 2026-10-19 at p01: 13.814N 100.737E; cumulative at point: -7.48 cm)
- Affected Population (GHSL GHS-POP E2025, 108d eq., ≥ 0.65 cm 2σ): 1,119,303 residents (< -2 cm), 261,087 residents across 48.85 km² (< -5 cm).
Top 3 Most-Subsiding Areas
| Rank | 1 km Block Center (Lat, Lon) | Cumulative LOS | Rate |
|---|---|---|---|
| #1 | 13.8137, 100.7374 | -7.48 cm | -6.24 cm/100d |
| #2 | 13.7666, 100.7467 | -7.20 cm | -6.00 cm/100d |
| #3 | 13.8415, 100.7857 | -6.93 cm | -5.77 cm/100d |
Top 5 At-Risk Infrastructure Segments
Infrastructure corridor ranking (OSM canal/road overlay) has not been computed for this regional subset yet.
GNSS Comparison & Calibration Status
Continuous GNSS time-series validation was not bundled for this regional subset.
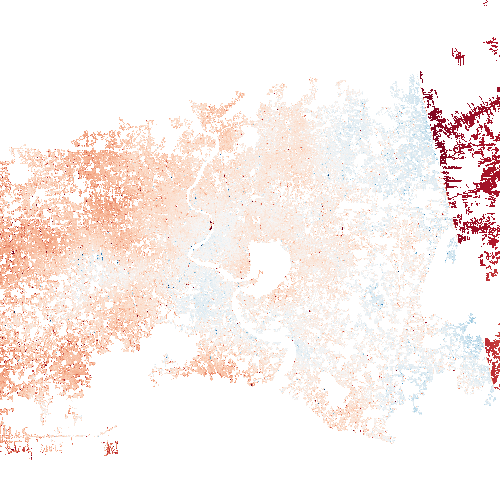
Cumulative Displacement Map
What This Means
- Peak measured ground motion in Bangkok (Thailand) reached -7.5 cm LOS (-6.2 cm/100d) from 2026-06-21 to 2026-10-19, but low coverage or wide reference spread makes this an indicative estimate.
- About 1,119,303 residents live on ground sinking faster than 2 cm per 108 days (and 261,087 residents across 48.85 km2 faster than 5 cm per 108 days, above the 0.65 cm 2-sigma noise floor).
- No local GNSS or canal-tilt overlay is bundled for this subset; field inspection and local piezometer records are needed to confirm infrastructure impacts.
Calibration & Quality Notice (PROVISIONAL): NISAR data are provisional. Calibration and validation are carried out by the NISAR project (NASA-JPL and ISRO), not by our team.
Sources: NASA-ISRO NISAR L2 GUNW (CRID P05023 via ASF DAAC); GHSL GHS-POP E2025 R2023A (JRC, CC BY 4.0); Nevada Geodetic Laboratory GNSS; OpenStreetMap (ODbL).
Sources: NASA-ISRO NISAR L2 GUNW (CRID P05023 via ASF DAAC); GHSL GHS-POP E2025 R2023A (JRC, CC BY 4.0); Nevada Geodetic Laboratory GNSS; OpenStreetMap (ODbL).